1.2.3 Bar Charts
(棒グラフ)

Next, let’s talk about bar charts. What are bars, by the way?

They are rectangular in shape like chocolate bars, gold bars, a bar of soap.
Exactly. So, a bar chart is a diagram that is comprised of multiple rectangular bars. Each bar represents a different category in the same data set. You can draw the bars vertically or horizontally, but provide them with equal width, and space them evenly. The height or length of each bar varies so that the difference in amount of each category is represented.
The bar chart drawn below shows the percentage of greenhouse gas emitted by top ten emitting countries and regions in 2013. They are arranged from the largest on top to the smallest at the bottom. This arrangement helps the readers or audience interpret bar charts, whether they are designed vertically or horizontally.
The bar chart drawn below shows the percentage of greenhouse gas emitted by top ten emitting countries and regions in 2013. They are arranged from the largest on top to the smallest at the bottom. This arrangement helps the readers or audience interpret bar charts, whether they are designed vertically or horizontally.
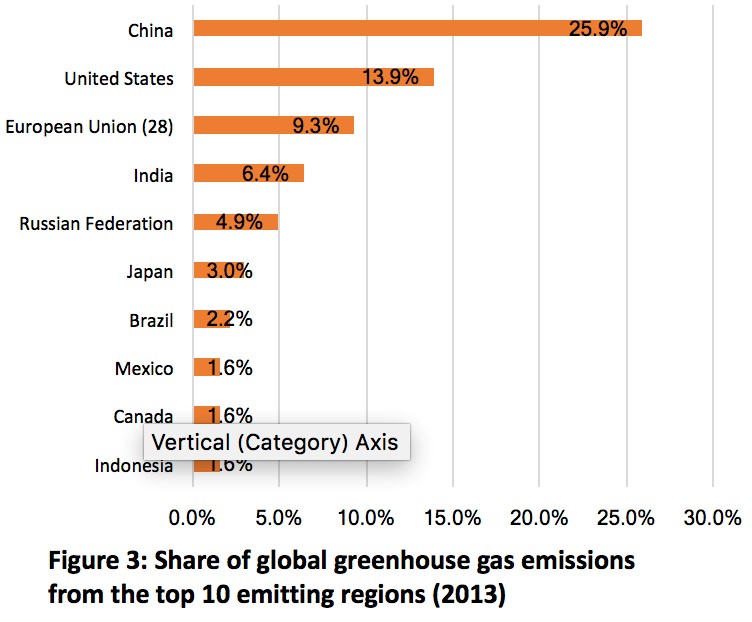
(Source: Environment and Climate Change in Canada)
https://www.ec.gc.ca/indicateurs-indicators/default.asp?lang=en&n=54C061B5-1
*The website is no longer available. [Dec 24, 2020]
https://www.ec.gc.ca/indicateurs-indicators/default.asp?lang=en&n=54C061B5-1
*The website is no longer available. [Dec 24, 2020]
Do you have any questions?
Yes, when should I use a bar chart?
You should use a bar chart when you want to compare different categories. In the chart above, for example, you want to see which country emits the most greenhouse gas. By just glancing at the chart, readers can tell which country emits the highest amount of gas and which country the least. In other words, rankings are quite obvious.
I see.