Quiz
1 point possible (graded)
1) Why is it important to use graphs, charts, and tables?
1/1 point (graded)
2) What kind of charts or graphs should you use when presenting how a set of data value changes over time?
1/1 point (graded)
3) Chose an appropriate expression that most accurately describes the line graph below.
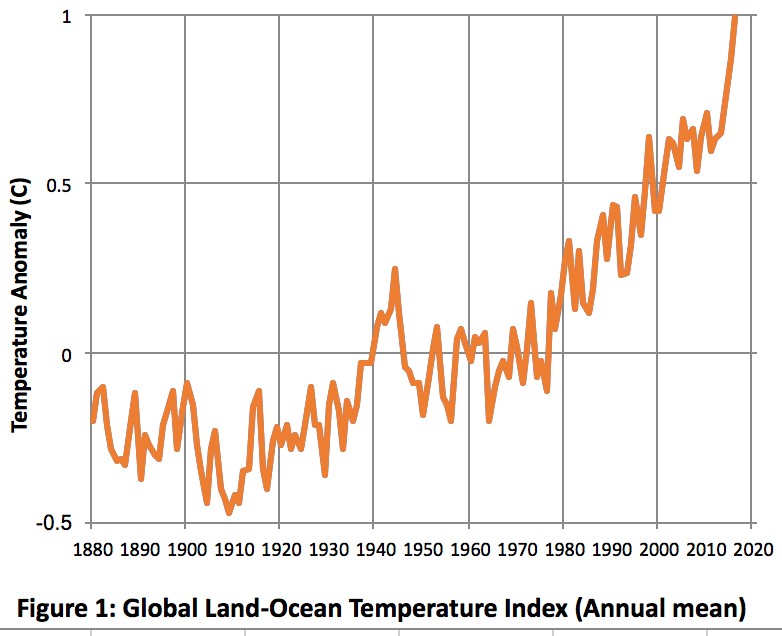
(Source: NASA)
https://climate.nasa.gov/vital-signs/global-temperature/
https://climate.nasa.gov/vital-signs/global-temperature/